Positive analysis: The gold/silver ratio reaches a high level

The Gold/Silver ratio has reached its highest level
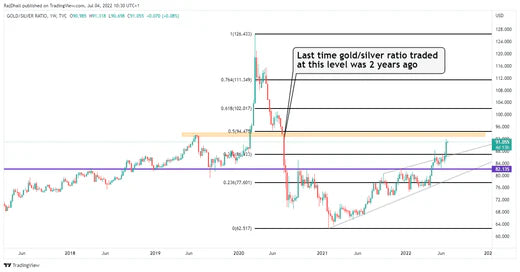
A Gold/Silver Ratio which tends to increase and a peak in 2 years. Silver has declined over the past few sessions and recently took important support at $20.46/oz. Gold also looked subdued, but the consolidation low still holds. Silver often moves in a more volatile style than the yellow metal. But when it comes to more economically tangible metals like aluminum, zinc, and copper, they've all been falling recently.
The Gold/Copper ratio
The gold/copper ratio has also just increased. And to release 500.00 up 23% over the last 4 weeks.
Gold in graph
Gold (and therefore its ratios) has struggled to stay above $1800 per ounce in recent sessions. But there is a “hammer candle” on the daily chart that suggests it might. Looking at the gold versus silver (weekly gold/silver ratio) chart below, the price has broken out of a converging pattern (wedge). The top of the pattern could be a support area. Below there is another support at the purple horizontal line.
On the top, there is some traffic ahead. Next is the orange zone at 93.30. This is also the 50% Fibonacci retracement zone from swing high to swing low. For now, the price is making higher ups and downs and gold is holding up better than silver. Which makes it an increasing gold/silver ratio.

Graph on the gold/silver ratio over 2 years
Discover our gold bars and coins
Source: Kitco


 Gold Bars
 Rare Gold Coins
 Modern Gold Coins
 Best Sellers
 French silver coins
